Real-time content analytics, designed for news publishers
Are people actually seeing and reading your stories? Track which articles on your website are being read right now. Monitor engagement as it happens. Make data-driven decisions in real-time with NowMetrix.
30-day free trial, no credit card needed
Trusted by 100+ NEWS Publishers


"The complexity of Google Analytics is a barrier to its use in our newsroom"
Unlike Google Analytics, which often has a 24-48 hour data delay, NowMetrix provides instant content performance insights. Delayed analytics mean missed opportunities; NowMetrix solves this. See what your audience loves the second it happens on our clear, easy-to-understand dashboard. Never wait for reports again. Publish new content and see its impact in seconds.
The Google Analytics Problem
Traditional analytics platforms like Google Analytics are a poor fit for newsrooms. Their complexity forces journalists and editors to waste hours navigating cumbersome dashboards and hunting for data among countless metrics, slowing down critical insights.
- Overwhelming interface with 100+ metrics
- Slow loading times when news breaks
- No focus on real-time article performance
- Requires analytics expertise to understand
- Not designed for editorial decision-making
- You're working with sampled and delayed data
The NowMetrix Solution
Understanding the unique demands of news, NowMetrix was created by former journalists specifically for publishers. We ensure editors receive only the vital, real-time data necessary for their work, presented exactly when it matters.
- See performance changes as they happen
- Simple: No training required, just intuitive insights
- Key metrics for editors: Reader activity, article trends & more
- Live-Tracking of Google Discover, UTM Campaigns, Referrals
- Real-time: Know immediately when stories take off
- Make decisions based on complete, unsampled data
See what your readers are reading now
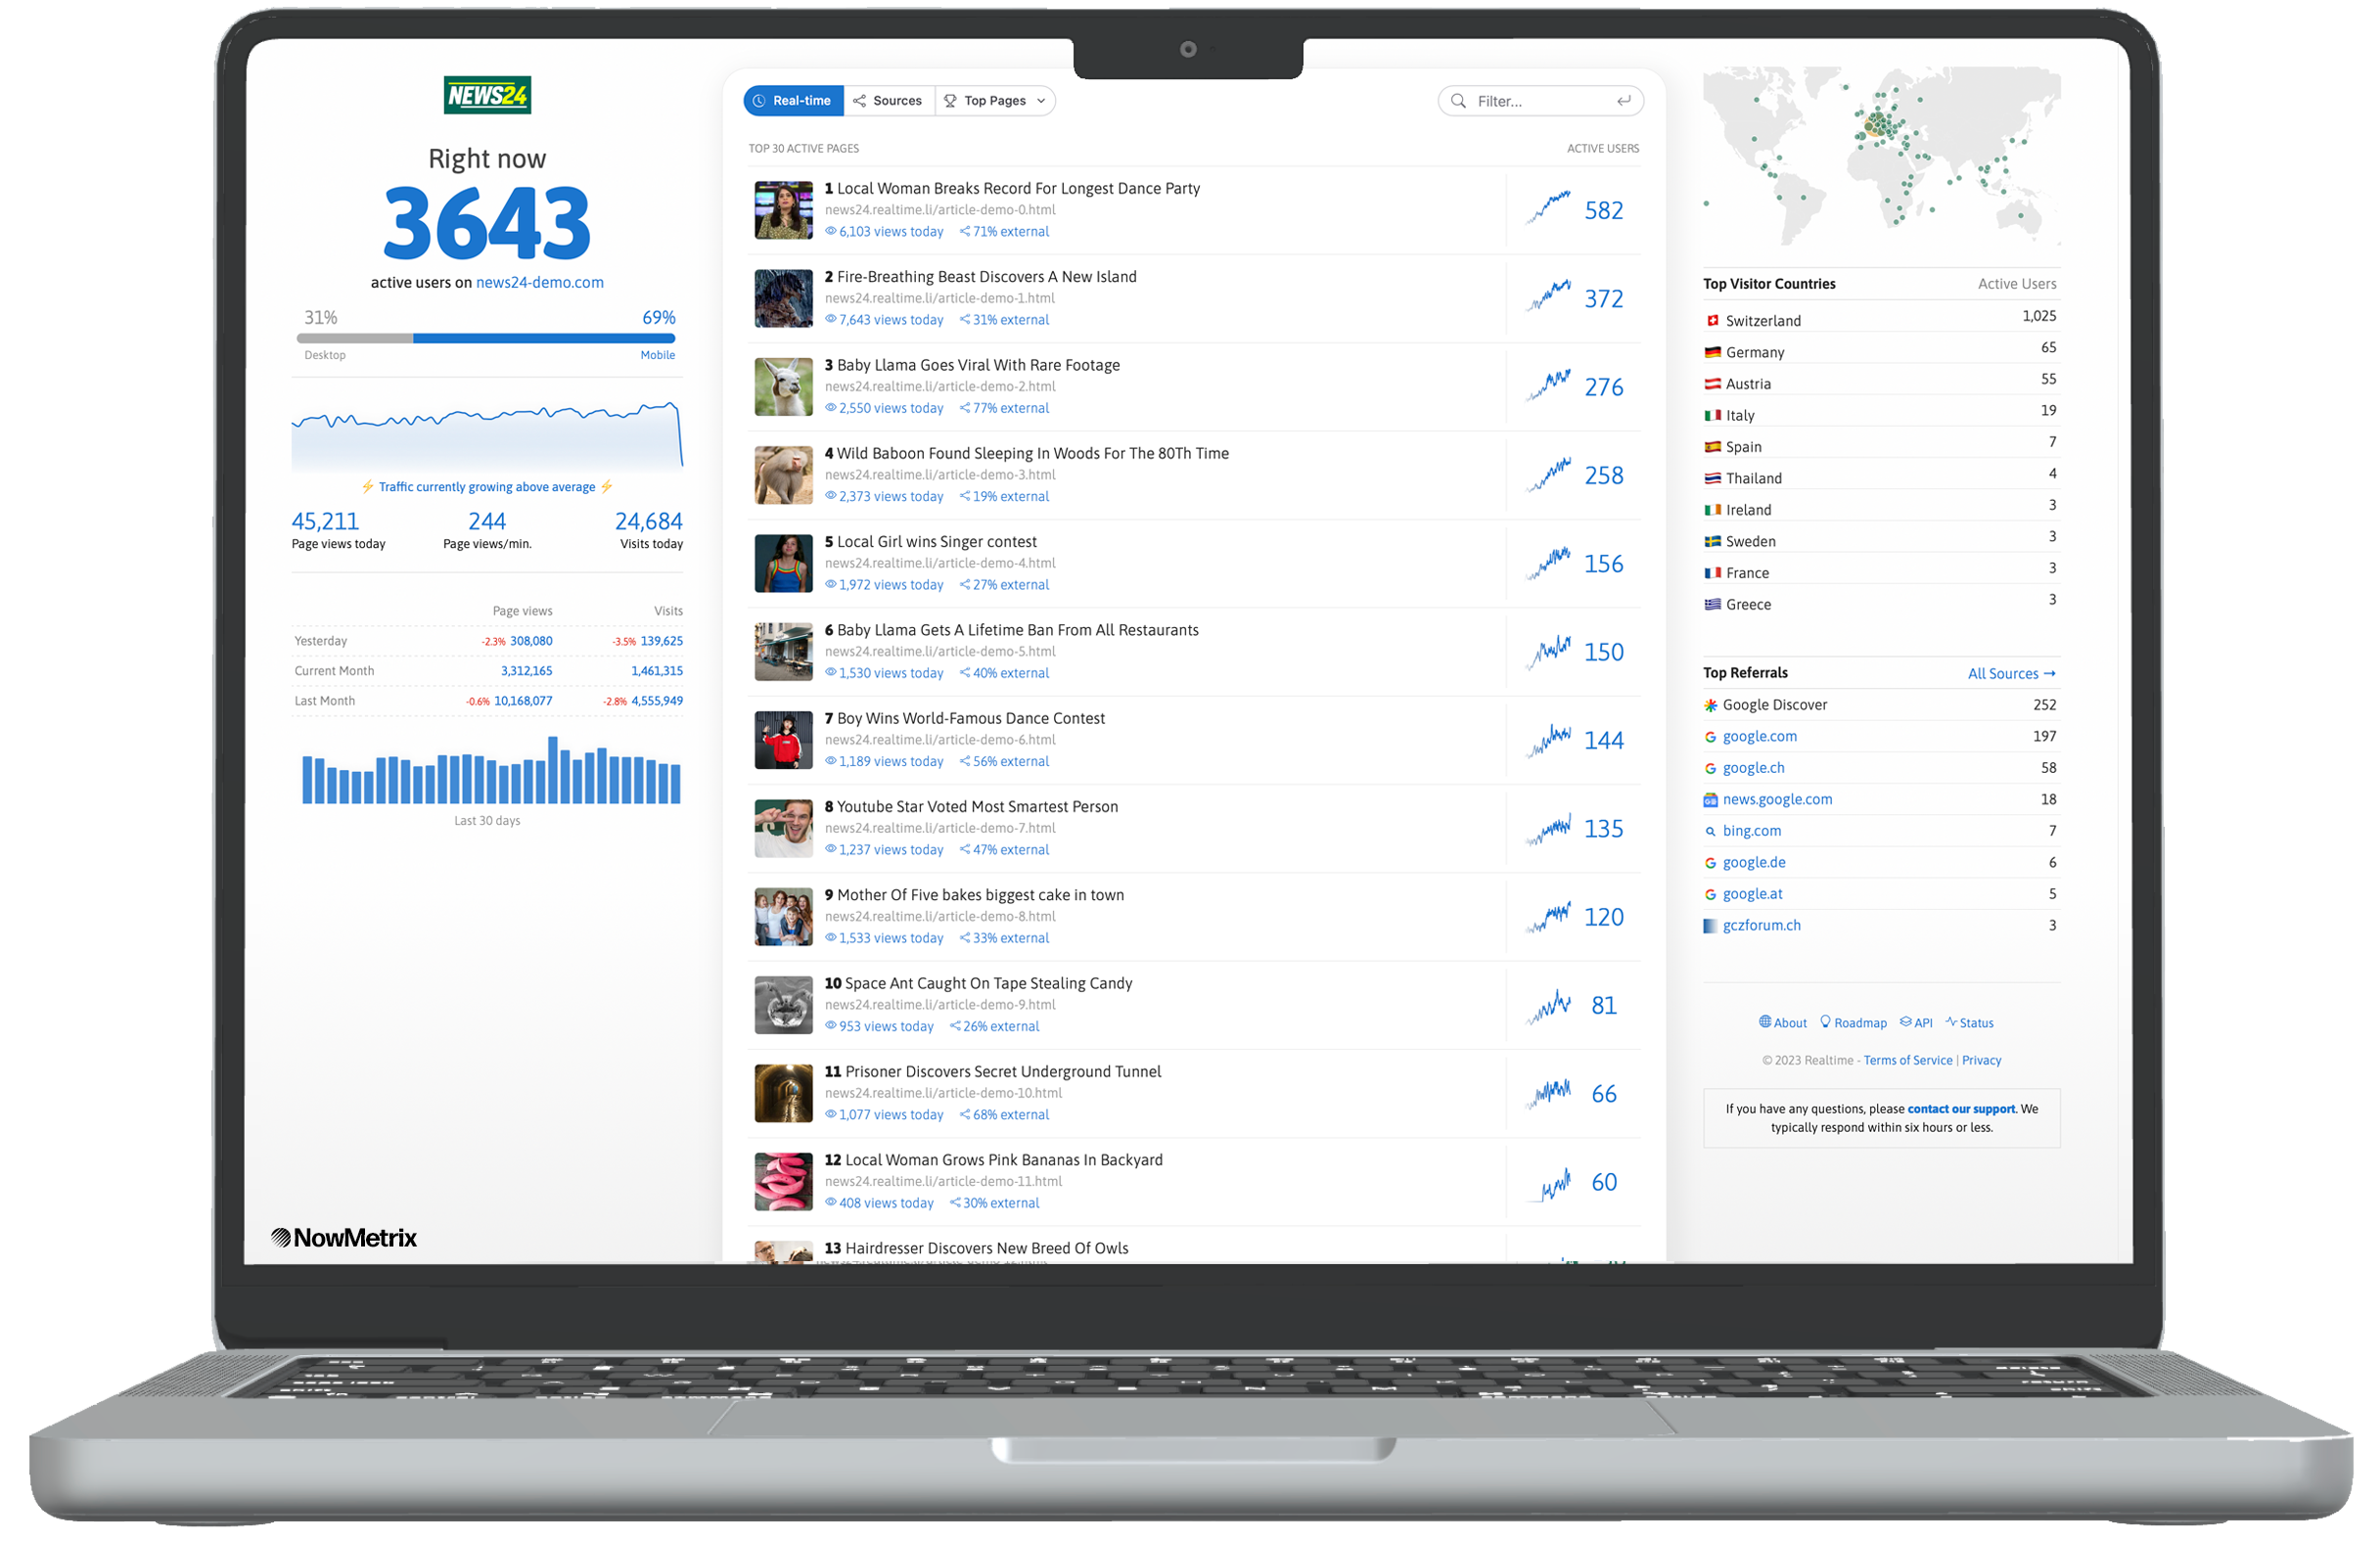
Optimize pages while readers are on your site, not after they’re gone
Monitor your publication’s performance as it happens. Our real-time dashboard updates every few seconds to show you exactly which articles are gaining traction, how many readers are actively engaged, and which stories are starting to trend.
- Live Performance Metrics: See active readers, engagement rates, and trending articles update in real-time
- Editorial Focus: Only the metrics that matter for editorial decisions - no data overload
- Mobile: Check performance on the go with our responsive dashboard
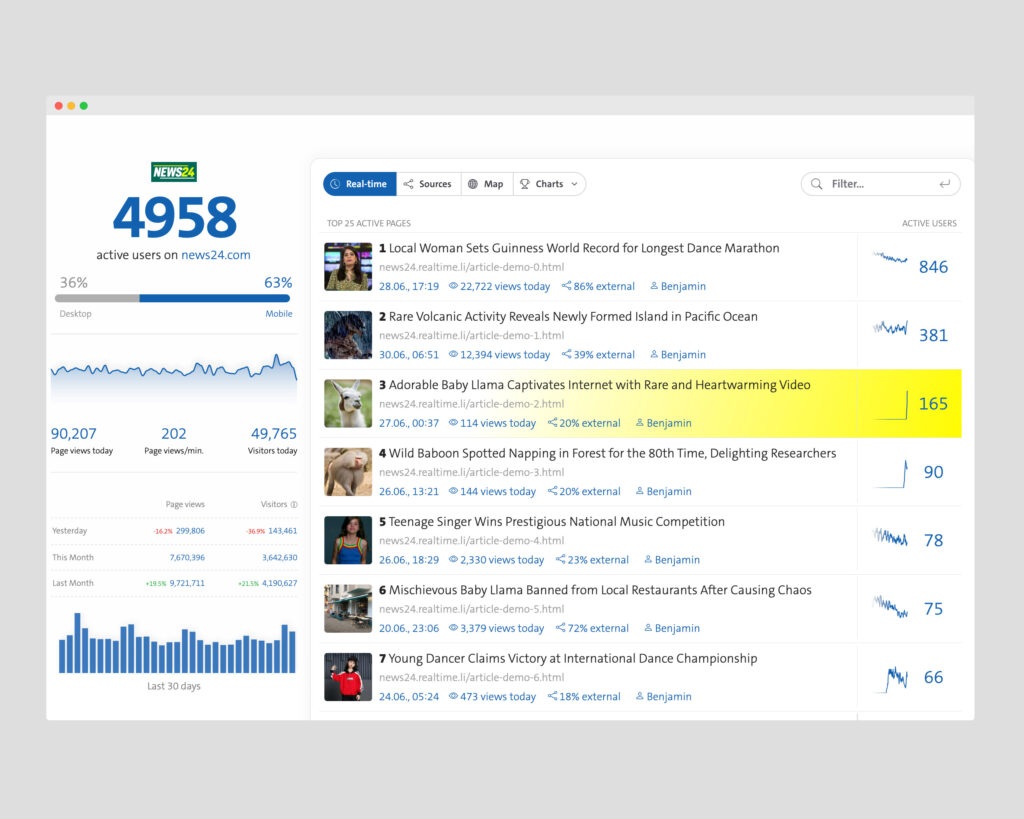
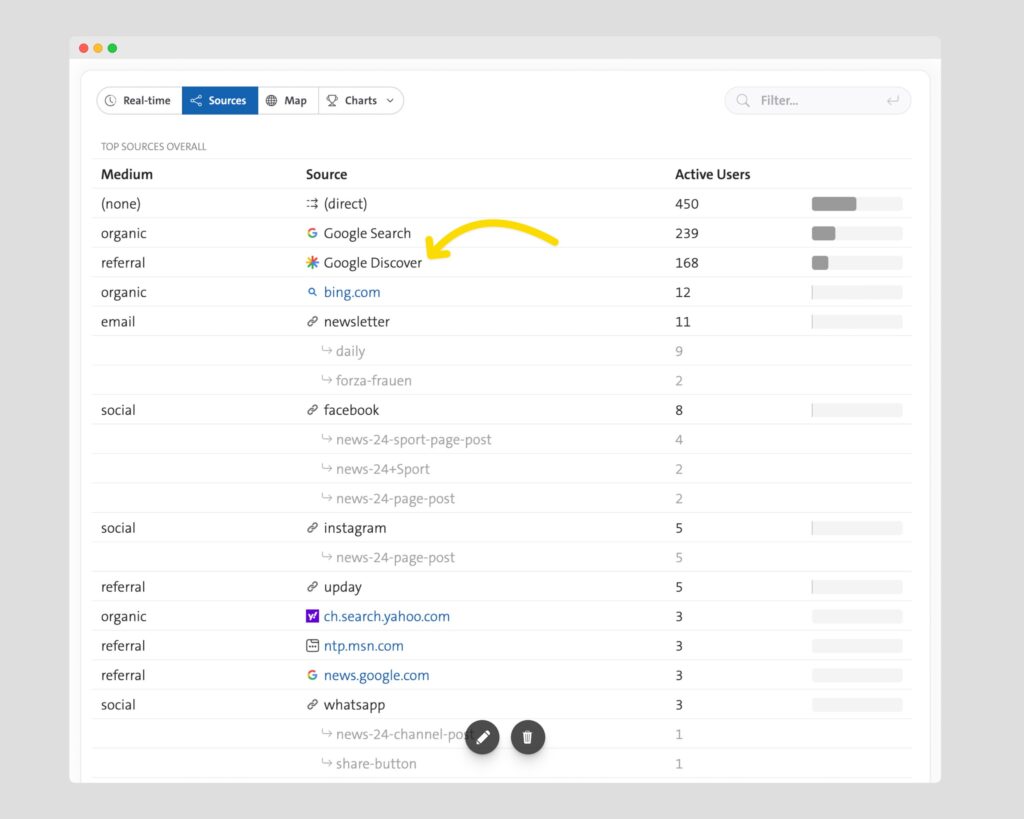
Real-time data for instant Google Discover understanding
Understand exactly where your readers are coming from. Track referrals, UTM campaigns, social media traffic, and even Google Discover performance to optimize your distribution strategy.
- Google Discover Insights: Monitor your articles' performance in Google's discovery feed in real-time
- Referral Tracking: See which websites, social platforms, and newsletters drive the most traffic
- UTM Campaign Analytics: Track the performance of your marketing campaigns in real-time
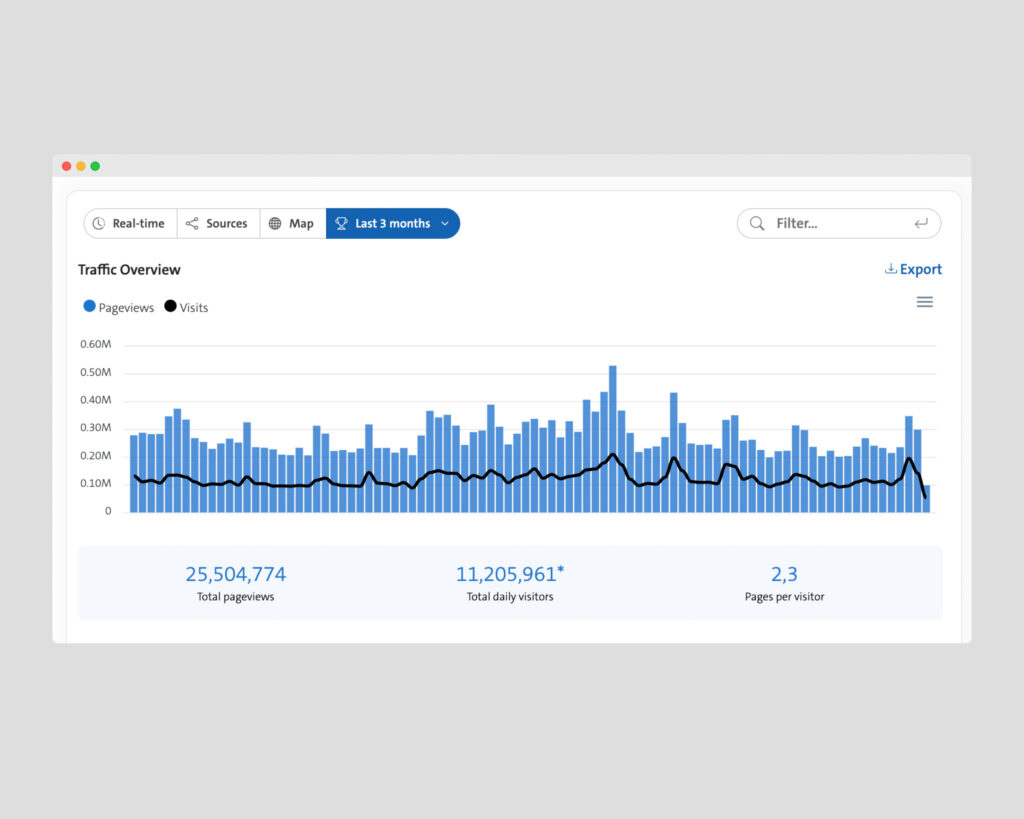
Give your editorial team the metrics they need, without the noise
Dive deeper into your content performance with historical data from the last months. Identify which articles performed best yesterday, last week, or over any custom time period to understand long-term trends.
- Performance Trends: Track how articles perform over time, from publication to peak engagement
- Top Performers: Identify your best-performing content from any time period
- Flexible Time Ranges: View data for yesterday, last week, month, or custom date ranges
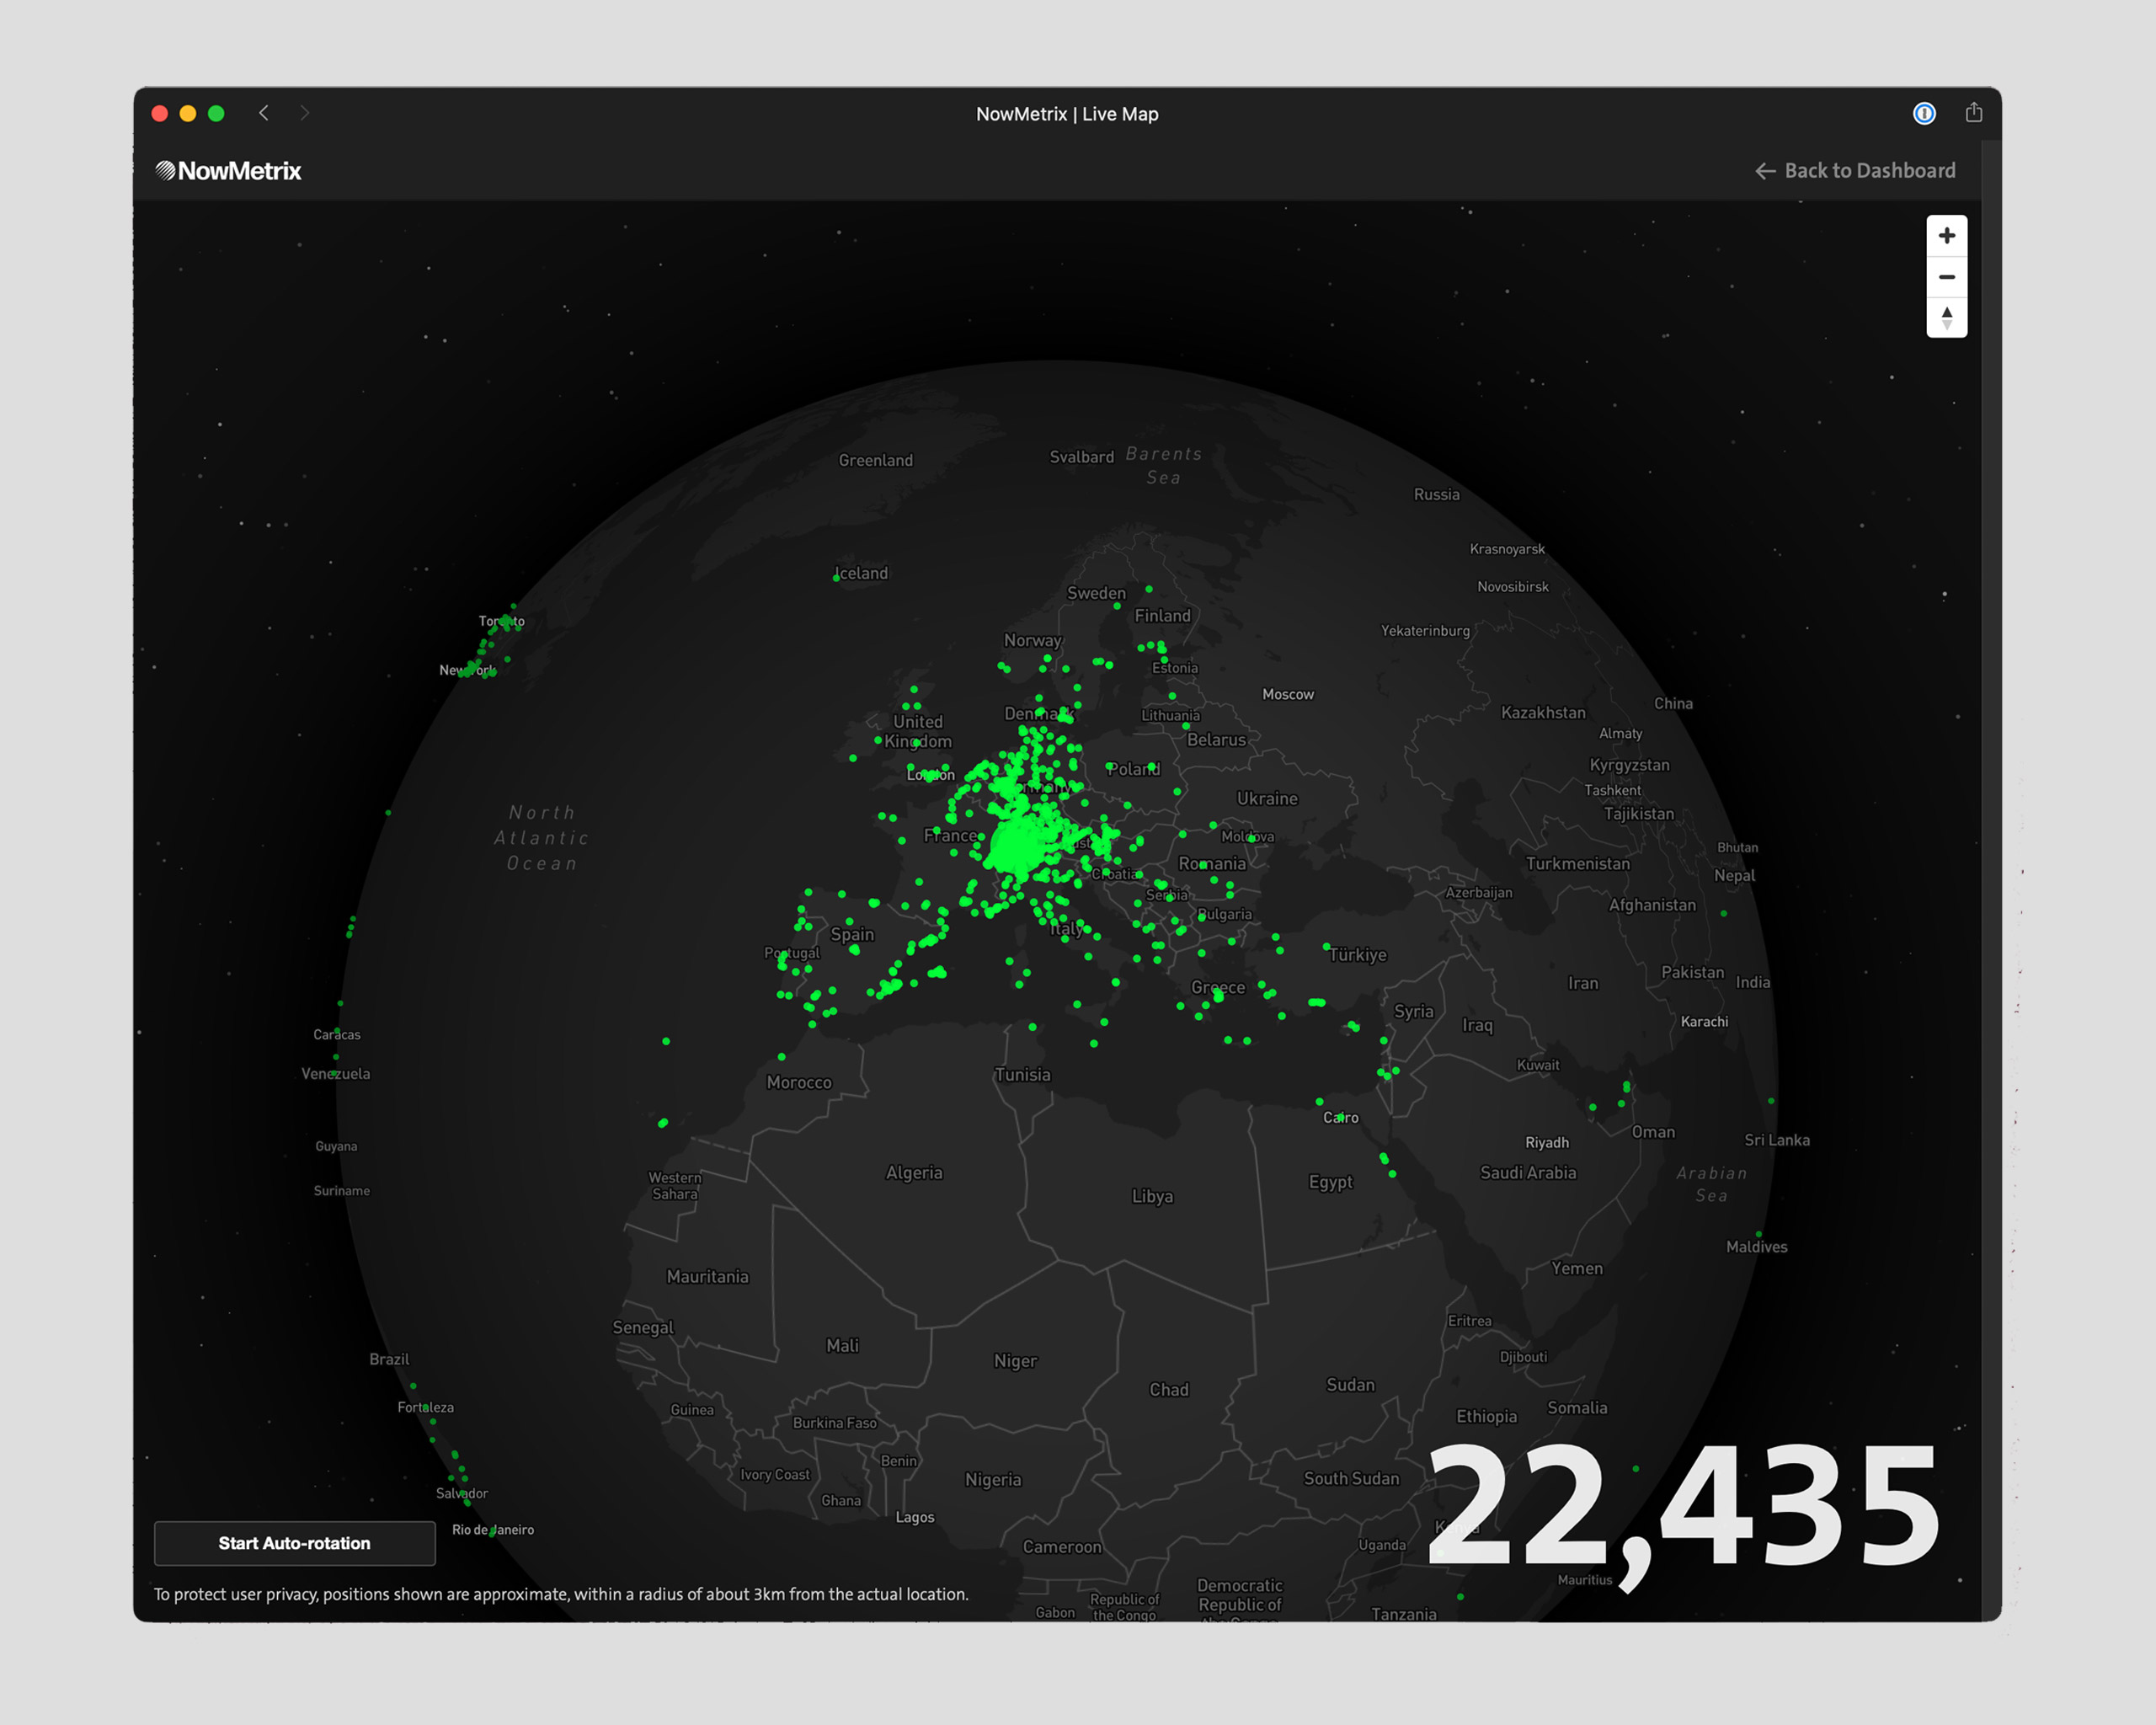
See where your content goes viral
Visualize your global audience in real-time with our interactive world map. Watch as readers engage with your content across different regions and spot emerging trends or viral moments as they happen around the globe.
- Global Audience View: See where your readers are located in real-time on an interactive globe
- Viral Detection: Spot when articles go viral in specific regions or countries
- Regional Trends: Identify geographic patterns in your content performance
Real-time API
Build custom dashboards, integrate our data into your CMS, or create dynamic content widgets for your website. Our real-time API gives you programmatic access to all your analytics data.
- Custom Integrations: Build your own dashboards or integrate with existing tools and workflows
- Website Widgets: Add "Top 10 articles right now" or trending content widgets to your site
- CMS Integration: Connect with WordPress, Drupal, or any content management system
User Needs Analytics
Go beyond just tracking clicks and page views. Our User Needs Analytics feature provides insights into what your users are actually trying to achieve, where they might be struggling, and what their unmet needs are.
- Discover new user needs, popular search terms, or desired features as they arise in real-time user behavior.
- Viral Detection: Spot when articles go viral in specific regions or countries
Uptime Alerts
Get alerted within 30 seconds if your website goes offline, and also when it comes back online.
Unsampled data
Make decisions based on complete, unsampled data.
No Cookies needed
Unlike Google Analytics, our tracking does not rely on cookies or local storage.
Hosted in Europe
Our infrastructure is hosted in Europe, with all operations managed from our headquarters in Switzerland.
Frequently asked questions
Our dashboard is designed specifically for newsrooms and content teams. The majority of our focus is on processing real-time data. Most user data is therefore deleted again after 24 hours. However, you can still check our dashboard to see which articles generated the most pageviews yesterday or on a specific date.
For more extensive long-term analyses, we recommend continuing to use an additional analytics tool. You can easily use our service simultaneously with other analytics tools such as Google Analytics, Adobe Analytics, etc.
No, your website speed is not affected in any way when using our service. Our script is barely 2KB in size and is delivered over a worldwide content delivery network (CDN). All statistics analysis is done in the background and does not affect the speed of your website.
Yes, our tracking pixel can be installed on your website with a few clicks. Most customers add our tracking code via Google Tag Manager, it’s done in a few minutes.
Of course, you can also add our tracking code by hand in the <head> section of your website. And if they are still using AMP, we offer a special tracking script for that as well.
You can track as many websites or domains as you want, and you’ll have access to each dashboard within your account. Pricing is calculated based on the total number of pages across all domains and websites, so they are all combined together in the calculation.
You can add unlimited team members to your dashboard for free. We don’t charge per seats.
We don’t penalize you for occasional traffic spikes, and we won’t shut your account off if you reach your plan limit early. In the event that you exceed your plan limit two months in a row or within the first month of joining our platform, we’ll simply inform you that your account is being upgraded. You can then choose to continue with the upgraded plan or cancel your account without any obligation.
All of our data is securely stored and hosted within the European Union, with our data centers located in Frankfurt and Nuremberg, Germany. We are committed to providing real-time analytics services, and as part of this commitment, we store user data for only 24 hours before it is permanently deleted. This ensures that we do not retain long-term data, aligning with our focus on real-time insights. Additionally, our use of a Content Delivery Network (CDN) ensures optimal global performance, offering fast and reliable access from any location around the world.
Just send us an email at info@realtime.li and we’re happy to answer all your questions.