
Realtime Analytics
The NowMetrix real-time dashboard shows editors active readers, top stories, traffic sources, devices, countries, and today’s pace while there is still time to promote, update, or follow up.
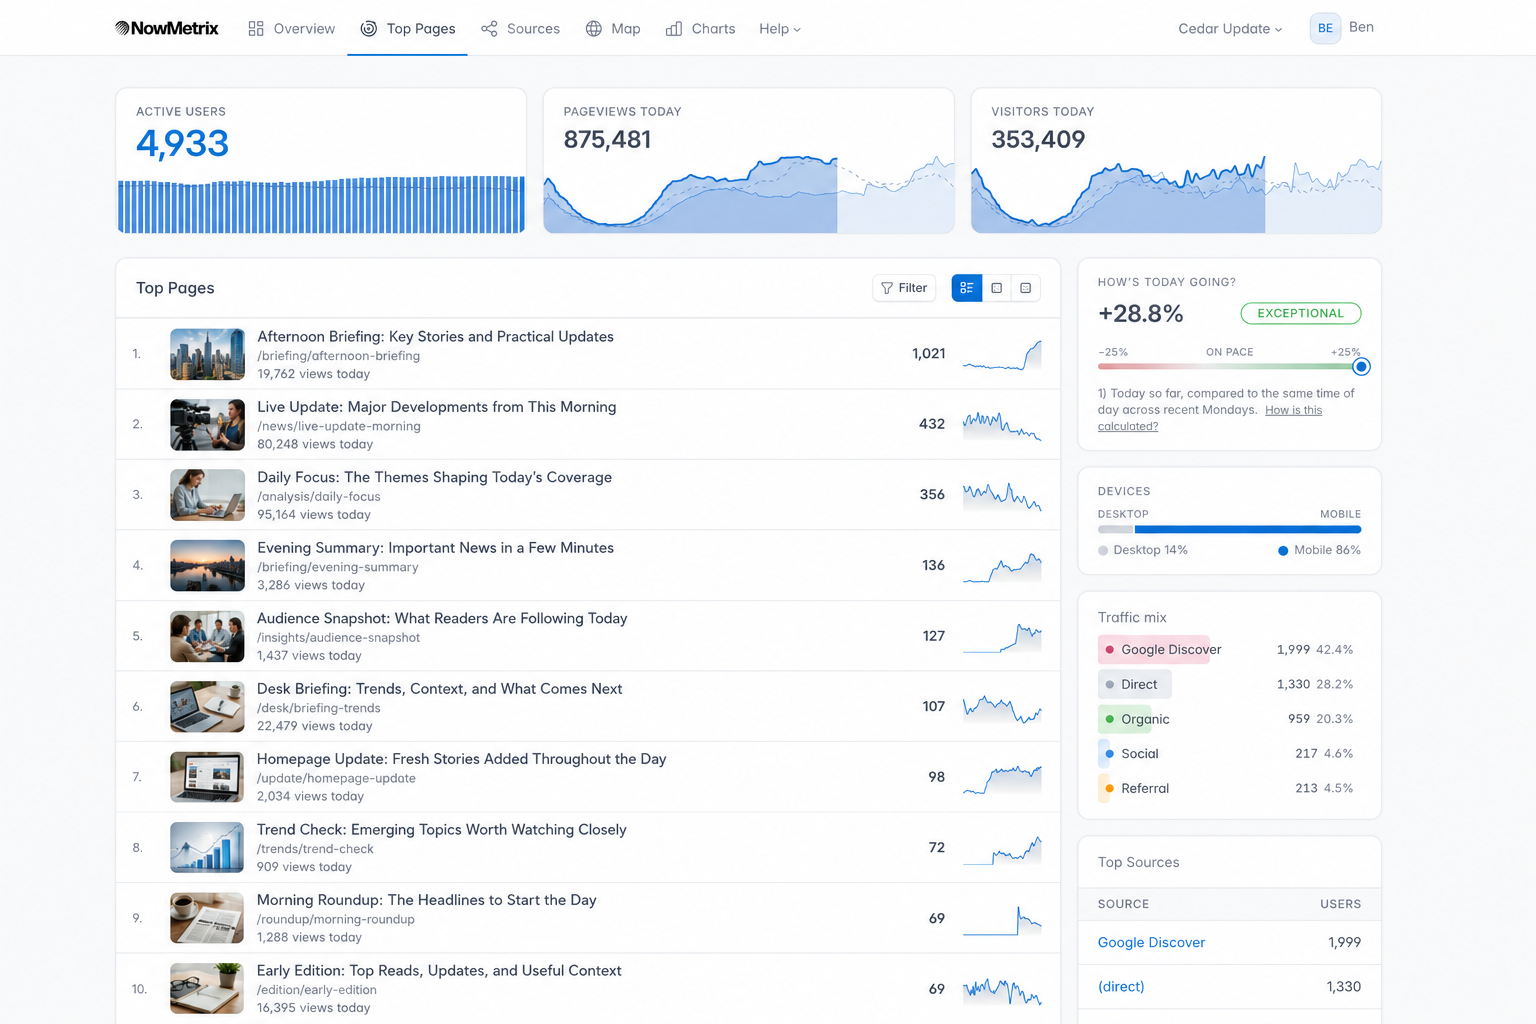
Keep it open all day. The dashboard refreshes automatically, so the newsroom always sees the current pulse.
Trusted by 150+ media brands and content teams







What the dashboard shows
See active users on your website in the last five minutes and understand the current audience pulse.
Track the top articles at the moment, with mini-charts showing whether attention is rising or fading.
Spot whether traffic is coming from search, direct, social, newsletters, campaigns, or referrals.
Understand the live split between mobile and desktop readers as your audience moves through the day.
Use the interactive world map and country list to see where current readers are located.
Filter by keyword or URL, then click a page to see more detail about its current traffic.
Editorial workflows
Move stories that are gaining attention into stronger positions before the traffic window closes.
Use the 30-minute pageview window and live top-page list to spot stories before they peak.
See when search, social, direct, or campaigns are driving a story and adjust promotion accordingly.
Compare today’s performance against yesterday, the current month, and your recent rhythm.
Pace
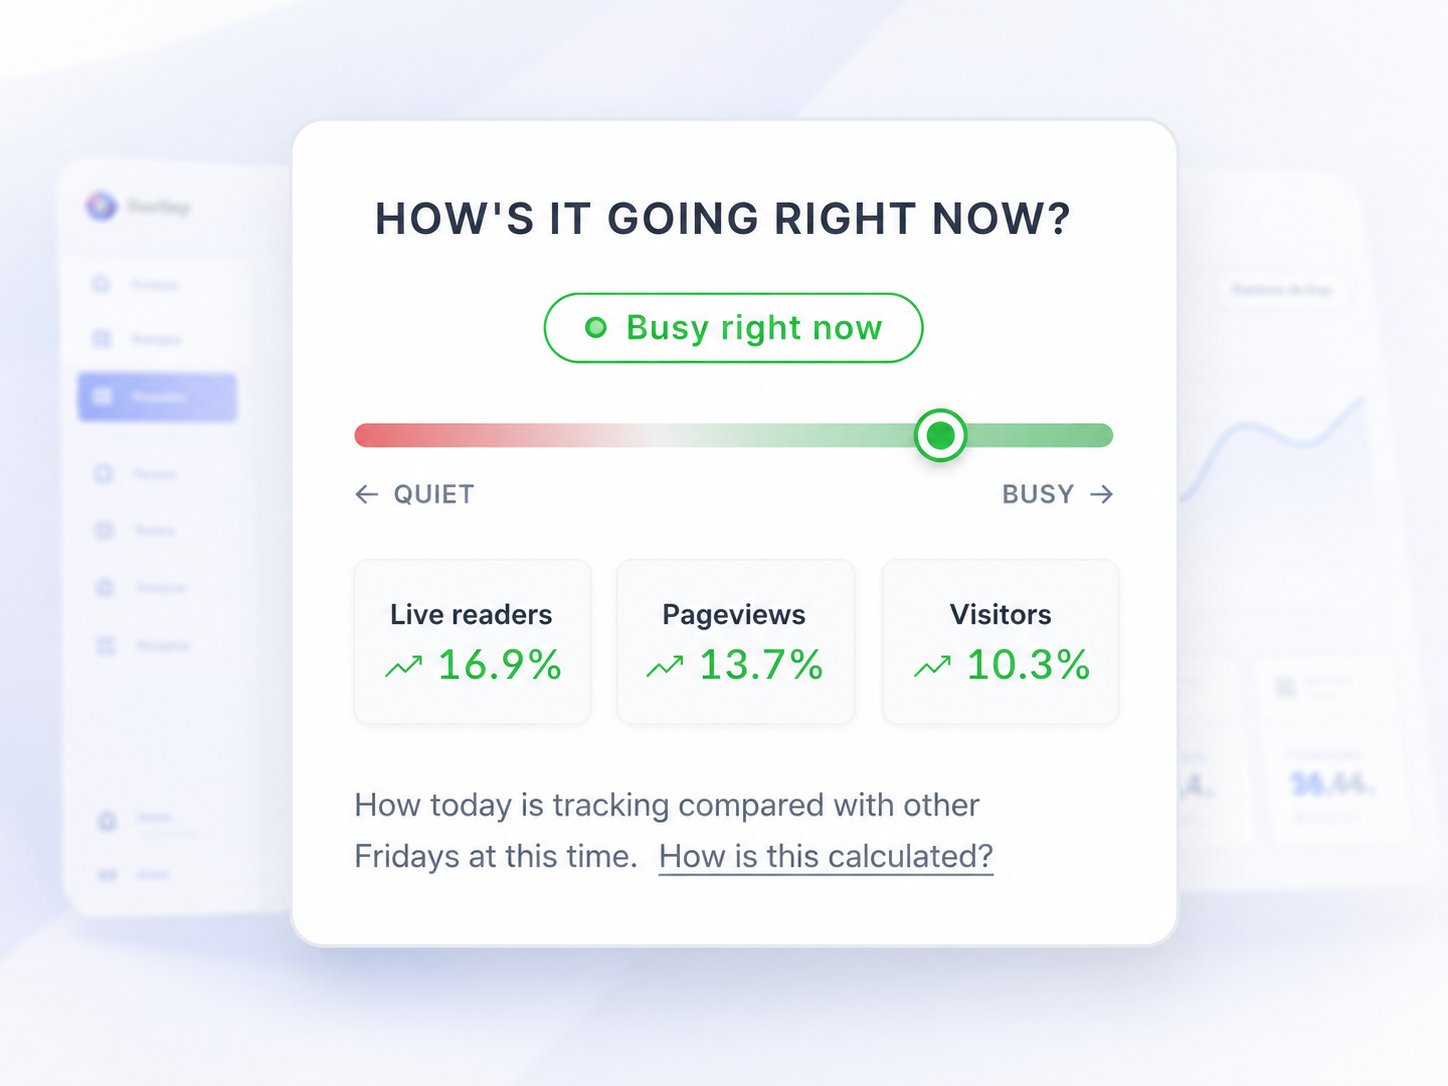
NowMetrix compares today’s live values with the median of the last 8 same weekdays at the same time of day. Editors see whether traffic is unusually high or low while there is still time to react.
“The integration of NowMetrix is done within seconds. But furthermore and the most important Point on the real-time Dashboards is, that it enables our editors to see reactions of readers on an easy to understand dashboard, which is running on the screen in our newsroom. One View and everybody knows what's happening on the site.”

Yves Hörler Head Technology and AdTech, streetlife.ch
30-day free trial
No reloads, no delay, no 100-metric maze. Just the numbers that help the next editorial decision.